DIY Voter Propensity Scoring
Most campaigns don't need enterprise analytics. They need a clear read on who's likely to show up — and a spreadsheet-sized method for getting it.
Voter propensity scoring is a technique used to predict which registered voters are most likely to turn out for an election. You can build your own propensity model using publicly available voter history data.
Voter propensity is a concept that “nerd sniped” the analytics/software engineer in me when I first got into campaigning. This guide shows you how to create custom voter propensity scores for off-cycle elections like city council races, school board elections, or special elections where turnout is significantly less than big ticket elections.
The screenshots below are from a voter data application I’ve built and deployed for local campaigns. The images show a fictional local election with fictional voters!
Step 1: Acquire the Data
Before you can score voters, you need a list of registered voters and their voting history. Every state makes this data available, though the process varies significantly from state to state.
Check out the Urnicus State-by-State Guide for breadcrumbs on obtaining voter lists and history files for your state.
Example: In Georgia, voter registration lists are available for purchase from the Secretary of State and voting history files are available for free download.
Note: Each state’s file format is unique. Georgia structures their data differently than Pennsylvania, which is different from Ohio. You’ll need to spend time understanding your state’s specific format.
Step 2: Filter for Your Voters
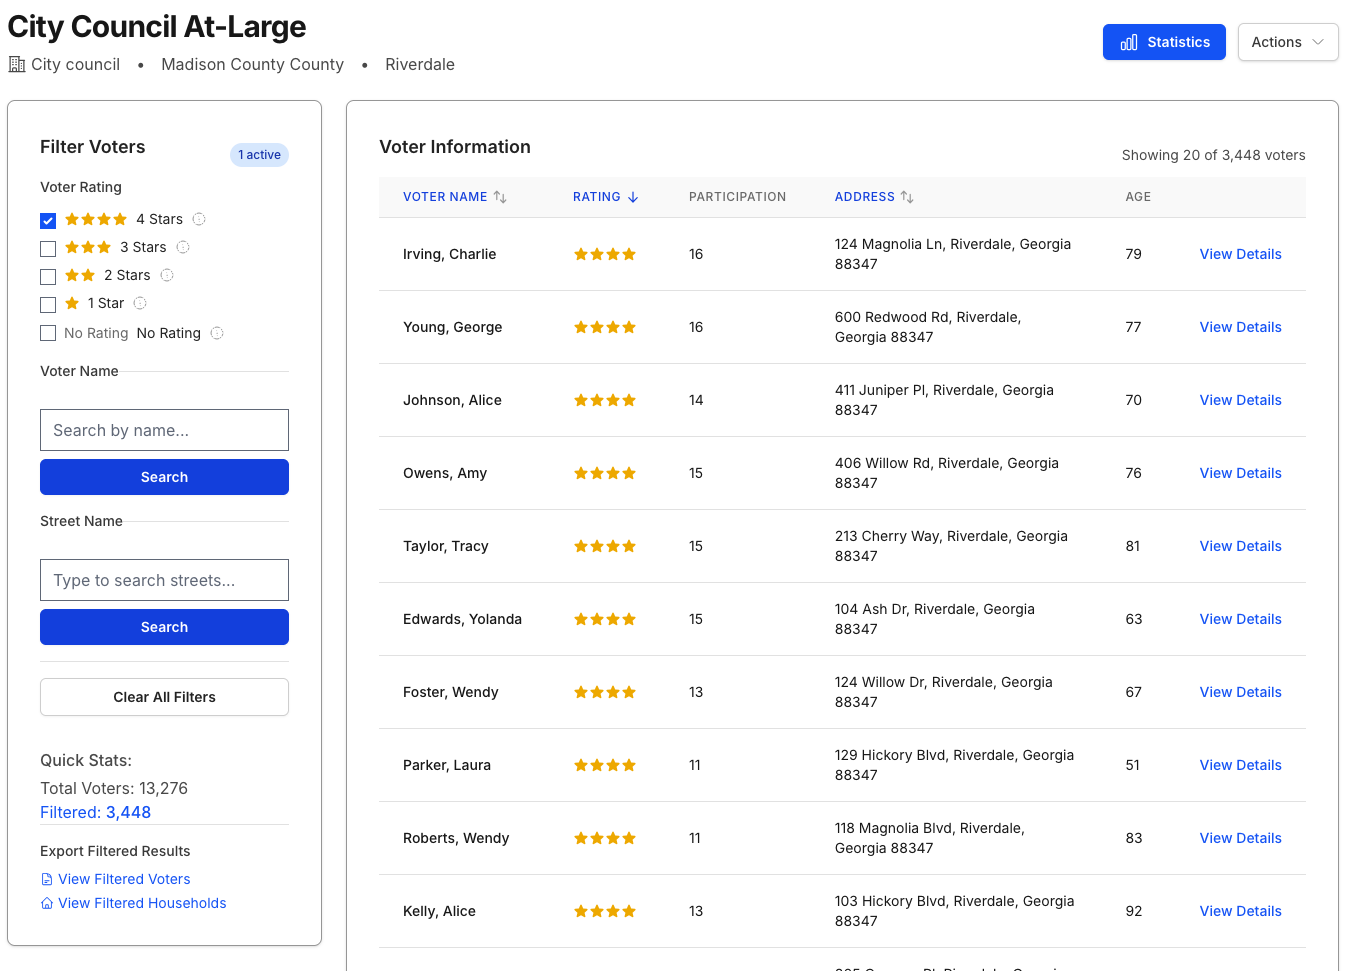 Filtering voters by star rating - showing only the most reliable local voters
Everything described in this guide can be done in Excel or Google Sheets. However, depending on your dataset size, you’ll quickly hit limitations.
Tip: Learn the basics of working with databases (SQL). The personal investment will pay off in the long run and make you far more effective at data analysis. Pair that with AI coding assistants (Claude Code, GitHub Copilot, etc.) to scale up to larger datasets with SQL or Python scripts.
Why you need to filter: State voter files include everyone registered in the state. If you’re working on a city council race in a town of 13,000 voters, you don’t want to wade through a file with 7 million registered voters (like Georgia).
Filter your data to include only voters who are:
- Registered in your specific jurisdiction (city, county, district)
- Active/eligible voters for the election you’re targeting
Step 3: Connect Voter History to Voters
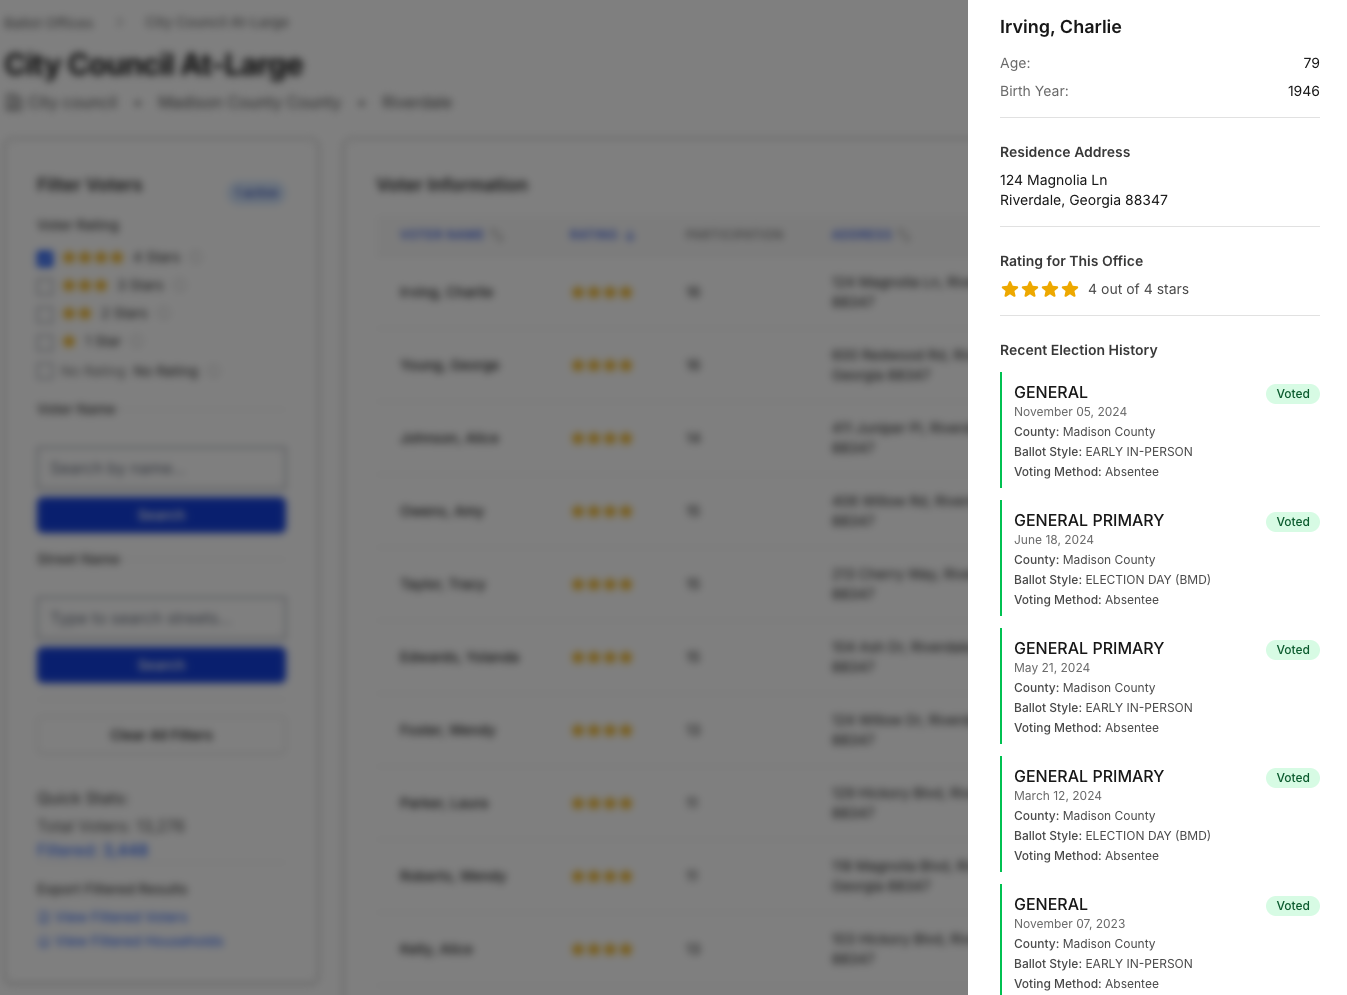 Individual voter view showing complete voting history and propensity rating
The goal is simple: For each voter in your list, you want to see which past elections they voted in.
This sounds straightforward, but states structure this data differently:
Georgia approach: Voter history is in a separate file. Each row represents one election that one voter participated in. You match these records to your voter list using a voter ID field.
Pennsylvania approach: Voter history is included directly in the voter list file, with columns for each recent election.
You’ll need to work with your state’s format to connect these dots. In Excel, use VLOOKUP functions. In SQL, use JOIN operations.
Once connected, you should be able to look at any voter and see a list of elections they participated in (e.g., “Voted in 2024 General, 2024 Primary, 2023 Municipal, 2022 General…”).
Step 4: Develop Your Algorithm - yippee!
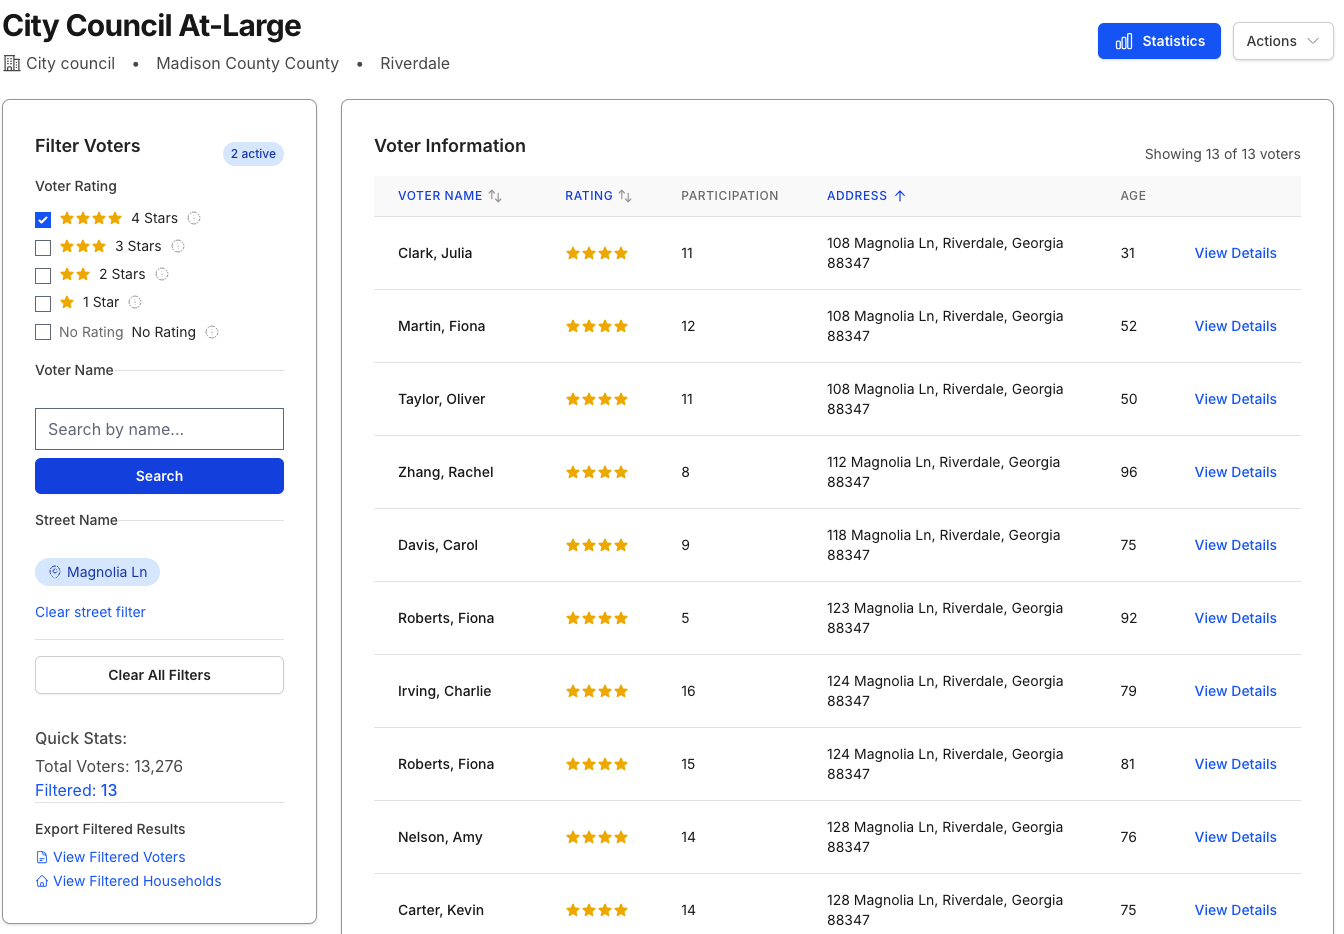 Filtering voters by both rating and street name for targeted door-knocking
You’re going to categorize voters based on their past voting behavior as it relates to the election you are targeting. For this example, we are looking at off-cycle elections and I’ve used a simple star-rating system:
4 Stars (Super Local Voters): These voters show up for everything - presidential elections, midterms, and off-cycle municipal elections.
3 Stars (Major Election with Some Local Voters): They vote consistently in major elections (Presidential and Midterms) with uneven local election participation.
2 Stars (Major Election Voters): They vote consistently in major elections.
1-0 Stars: Registered but rarely or never vote.
Why this works: In a local election, your 4-star voters are far more likely to show up than your 2-star voters. Focus and segment your resources based on the voters most likely to actually cast a ballot.
Caveat: This method will underweight newly registered voters and voters who recently moved into your district (since they have no local voting history). You may want to treat new voters separately or develop a secondary model for them.
Step 5: Put Your Data to Work
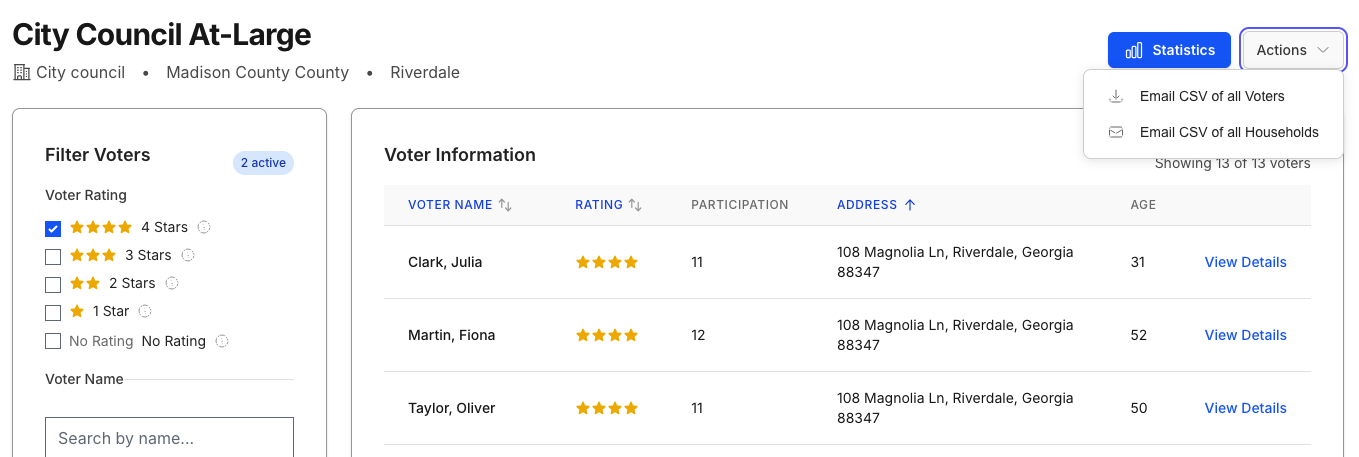 Export options for creating targeted voter and household lists
Once your voters are scored and your data is organized, you can:
- Create walking lists sorted by street address and propensity score
- Build household lists for mailing (one piece per household instead of per voter)
- Target high-propensity voters who align with your campaign message
- Allocate resources efficiently by focusing resources on voters based on their likelihood to turn out.
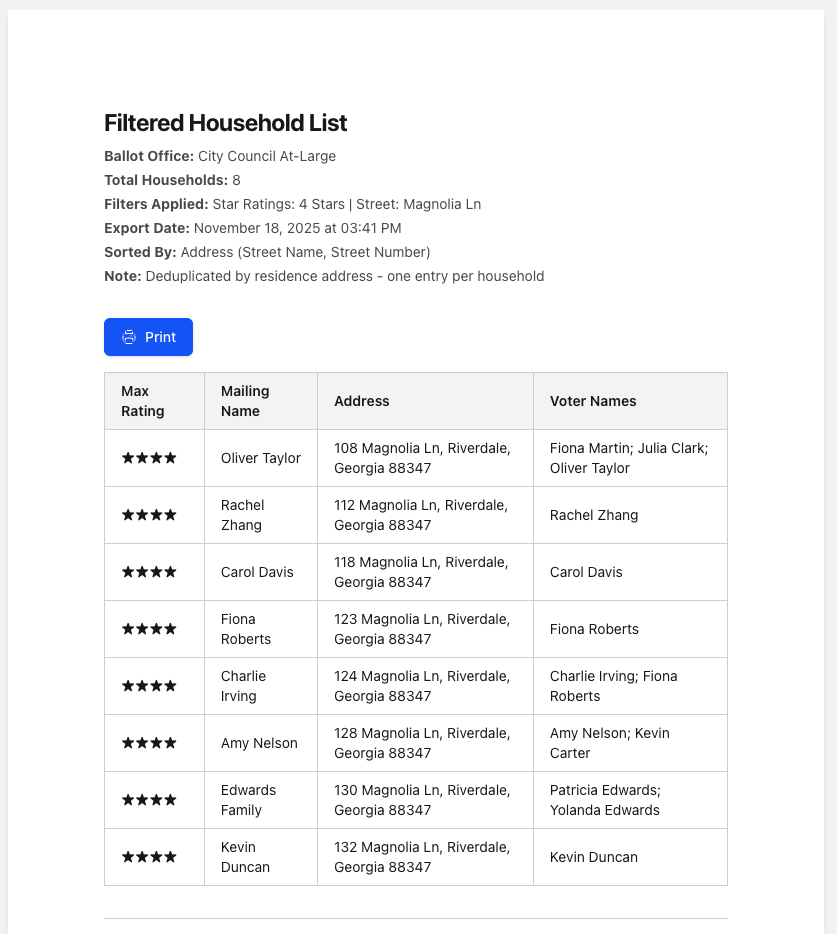 Sample household list sorted by address, showing max rating per household and all voter names
You can continue to layer on additional data to refine your targeting:
- Age demographics
- Party affiliation (in states where it’s available)
- Geographic micro-targeting (specific neighborhoods or precincts)
- Issue-based targeting (if you have survey or modeling data)
Can you do this in Excel? Yes, absolutely. Sort, filter, and export away. I built a specialized tool because I found myself doing these same operations repeatedly across campaigns. The screenshots in this guide show that tool in action as a visual explainer.
This guide is part of the Urnicus campaign resources series. For more writing from the practice, visit the field notes.
Last updated: December 2, 2025